On February 14, 2003, I had the worst job interview of my
life. After a few preliminary questions, the interviewer asked “What type of marketer are
you? Are you analytical or creative?” I felt like this was a trick question.
“Did he want me to be creative? Was he looking
for analytical?” Nervous and unsure about the correct answer, I responded “I feel that I am both.” He then
proceeded to lecture me on the scientific reasons people can only be analytical
or creative – not analytical and creative. I emphatically disagreed and proceeded
to argue back…for the next 45 minutes. I knew I wasn’t getting the job about
five minutes in, but there I was at 5 p.m. on Valentine’s Day fighting for my
right to be a multidimensional, analytical/creative marketer.
Truth be told, I don’t love math (or numbers), but I have
always liked using data to drive decisions and build marketing strategies. All
marketers, both analytical and creative, need to use data to gauge marketing
effectiveness, set pricing, propose projects and support marketing, sales and
business initiatives. Anyone can have a “good idea,” but how can you support its
feasibility without data?
The wide range of analytics tools available makes analysis
and data usage easier than ever – even for creative types. With today’s tools,
marketers don’t need to know how to crunch numbers, but they do need to know
how to use them.
Visual Analysis – Even Better
Today, Google announced the launch of Browser-Size analysis
in Google Analytics. This new feature
addresses the increased number and variety of devices which people are using to
view web content. According to the Google Analytics Blog:
What is actually “above the fold”
on a web page is a significant factor to conversion rates. If visitors have to
scroll to see an “add to cart” button, or some other critical element, they may
never get around to it. …we've created a visualization that lets you quickly
determine which portions of your page are visible to which percentages of
visitors. (Yahas, 2012).

The graphic is a visual display of in-page analytics. By
clicking “Browser Size” it shades the sections of the page that are below the
fold. The new feature also includes insight on conversions. “For example, if
users on your goal page appear to have larger browsers than those on your
landing page, this is a strong indicator that you are losing conversions
because some pages in the funnel are not laid out in an optimal manner.” (Yahas, 2012). Google
will be rolling out all of the features of Browser-Size Analysis in the coming
weeks – and I am excited to play around in there.
YouTube Metrics
YouTube analytics (which are part of Google analytics) are
also full of visual metrics – which I
love. In addition to tracking the number of viewers, YouTube tracks the playback
locations (YouTube channel, mobile device, etc.), demographics, views over
time, regions in the world (or country), and engagement.
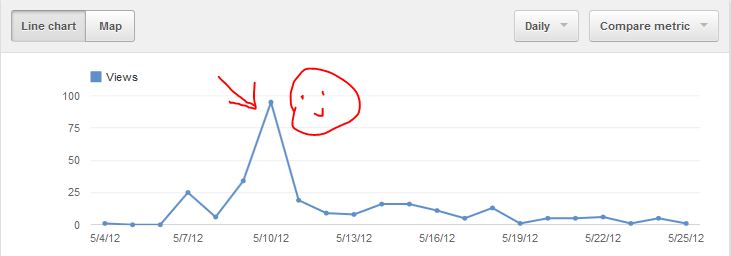
I am a big fan of the chart showing views by day, since I
can match up my marketing efforts to changes in traffic. In the graph below, I
took a video that had been posted on our website for several days – and sent it
out through Twitter, Facebook, StumbleUpon, Pinterest and Scoop.it. The effort produced
a spike in views for one day – higher than the combined views of the previous
days and the days following.
Video production takes a lot of work, and if you’re
investing hours in scripting, filming and editing, but seeing few results, it’s
time to rethink your video strategy.
Yahas, G. (2012, June 4). [New Feature]: Conduct Browser-Size Analysis Within Google Analytics. Analytics Blog. Retrieved June 4, 2012, from http://analytics.blogspot.com/
No comments:
Post a Comment